
Reliability report
MG reliability by model
11 MG models compared with the average car of the same age – based on UK MOT tests, cross-checked with Dutch APK and Lithuanian inspections.
Photo: Kevauto, CC BY-SA 4.0, Wikimedia Commons

MG ZS
much worse than average- 🇬🇧 MOT fail rate
- 20.2% / 14.4%

MG 3
much worse than average- 🇬🇧 MOT fail rate
- 21.5% / 17.0%

MG TF
much better than average- 🇬🇧 MOT fail rate
- 26.5% / 32.1%
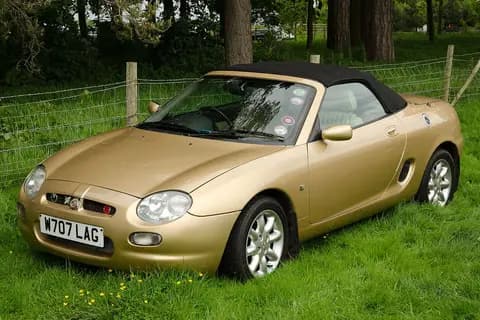
MG MGF
better than average- 🇬🇧 MOT fail rate
- 29.1% / 31.4%
- 🇳🇱 APK defects
- 56.8% / 68.4%

MG 5
much worse than average- 🇬🇧 MOT fail rate
- 14.1% / 9.9%

MG B
much better than average- 🇬🇧 MOT fail rate
- 15.4% / 31.4%
- 🇳🇱 APK defects
- 61.7% / 68.4%

MG GS
much worse than average- 🇬🇧 MOT fail rate
- 21.3% / 16.8%

MG ZR
much better than average- 🇬🇧 MOT fail rate
- 27.5% / 32.1%
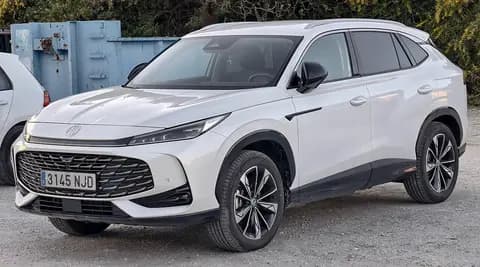
MG HS
worse than average- 🇬🇧 MOT fail rate
- 10.8% / 9.9%

MG 6
much worse than average- 🇬🇧 MOT fail rate
- 31.2% / 26.3%
MG 4
much better than average- 🇬🇧 MOT fail rate
- 7.7% / 9.9%
The figure after the slash is the average for cars of the same age in that country. Contains public sector information licensed under the Open Government Licence v3.0. Photos: Wikimedia Commons – authors and licences on the model pages.