
Reliability report
Mercedes-Benz B-Class reliability and common faults
Based on 113,256 roadworthiness tests, led by the UK MOT. Each country is compared only with its own average for cars of the same age.

🇬🇧 United Kingdom · MOT
24.6%
fail rate · average 26.3%
better than average
58,016 MOT tests (DVSA)
🇳🇱 Netherlands · APK
41.7%
with defects · average 52.0%
much better than average
44,910 APK inspections (RDW)
🇱🇹 Lithuania · inspection
53.7%
first-time pass · average 53.4%
about average
10,330 inspections
Testing regimes differ from country to country – don’t compare the figures between countries; compare each one only with its own average. MOT data: contains public sector information licensed under the Open Government Licence v3.0.
Weak spots
What goes wrong on the Mercedes-Benz B-Class
How often each area fails compared with the average car of the same age (vertical line = average, 100%). Red – more often than average.
Wheels
Seat belts and airbags
Tyres
Exhaust and emissions
Suspension
Visibility
Plates and identification
Brakes
Lights and electrics
Body and structure
Steering
Most common test failures
- 1Tyre pressure not at correct value
- 2Tyre(s) with tread depth of 1.6 to 2.5 mm
- 3Tyre insufficient tread
- 4Low beam incorrectly adjusted
- 5Driveshaft boot damaged and not sealing
- 6Tyre damaged
- 7Spring broken or cracked
- 8Mechanical parts of the brake system show wear
- 9Steering knuckle (ball joint) too much play
- 10Number plate light doesn't work (properly) / missing
- 11Steering or steering knuckle ball joint with wear of 1.0 mm or less
- 12Windscreen wiper system gives insufficient visibility
Results by vehicle age
| Age | 🇬🇧 MOT fail rate | 🇳🇱 APK defects |
|---|---|---|
| 3–5 years | 7.5% avg 9.9% | 20.4% avg 27.0% |
| 6–8 years | 9.2% avg 15.3% | 26.8% avg 36.7% |
| 9–11 years | 20.6% avg 22.9% | 32.5% avg 44.4% |
| 12–15 years | 28.4% avg 30.3% | 39.8% avg 55.4% |
| 16–20 years | 36.0% avg 34.6% | 61.3% avg 64.7% |
| 21+ years | — | 65.1% avg 68.4% |
🇱🇹 First-time pass rate in Lithuania – by year of manufacture
| Year | B-Class | Average for year | Inspections |
|---|---|---|---|
| 2017 | 67.4% | 76.6% | 46 |
| 2016 | 76.7% | 72.8% | 103 |
| 2015 | 68.0% | 71.1% | 147 |
| 2014 | 66.5% | 68.0% | 248 |
| 2013 | 64.8% | 65.9% | 307 |
| 2012 | 67.7% | 63.7% | 607 |
| 2011 | 54.2% | 61.2% | 426 |
| 2010 | 52.2% | 57.3% | 625 |
| 2009 | 52.0% | 54.5% | 767 |
| 2008 | 52.5% | 52.4% | 1,450 |
| 2007 | 50.6% | 50.6% | 1,810 |
| 2006 | 49.9% | 48.7% | 2,356 |
| 2005 | 51.4% | 46.6% | 1,389 |
Mercedes-Benz B-Class – FAQs
How reliable is the Mercedes-Benz B-Class?+
In the UK the Mercedes-Benz B-Class fails 24.6% of MOT tests, against an average of 26.3% for cars of the same age – better than average. In the Netherlands, inspectors found defects at 41.7% of APK inspections (average there 52.0%) – much better than average. In Lithuania 53.7% pass their roadworthiness test first time (average for those years there 53.4%) – about average.
What goes wrong most often on the Mercedes-Benz B-Class?+
Compared with the average car of the same age, testers find faults more often in these areas: wheels, seat belts and airbags.
What should I check when buying a used Mercedes-Benz B-Class?+
The most common inspection failures: Tyre pressure not at correct value; Tyre(s) with tread depth of 1.6 to 2.5 mm; Tyre insufficient tread; Low beam incorrectly adjusted; Driveshaft boot damaged and not sealing. Before you buy, also check the free MOT history on GOV.UK and the car’s history by reg or VIN (mileage, damage, theft).
More Mercedes-Benz models


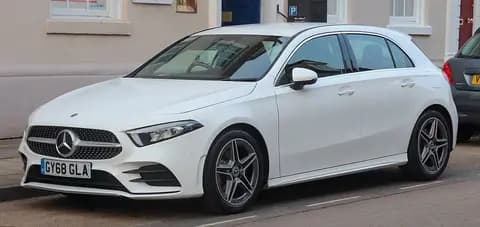





Sources: anonymised MOT test results (DVSA) – contains public sector information licensed under the Open Government Licence v3.0; APK inspection defects (RDW, open data); Lithuanian roadworthiness test results (data.gov.lt). Initial tests only; retests are not counted. Photo: Alexander Migl, CC BY-SA 4.0, Wikimedia Commons (licence).